Contents
What is Site Analysis?
Architecture site analysis is the process of researching and analysing the social, historical, climatic, geographical, legal, and infrastructural characteristics of a given site, and synthesizing these analyses into visual information — usually in the form of site analysis diagrams.
The examination of these characteristics in conjunction with your established project goals are the foundation for making informed decisions throughout the design process, commonly influencing a project’s programmatic realities as well as structural and potentially aesthetic decisions such as shape, form and material.
Site analysis diagrams are the graphic translation of key observations and analyses as they relate to the material conditions of a site.
Common themes appearing in site analysis diagrams include sun and shade paths, movement and circulation patterns, land use, and public space vs. private space.

How to do Site Analysis
The more context you can gather from your site analysis, the better informed you’ll be to produce your design.
The first step to beginning site analysis is to research your site before you get there — doing so will allow you to approach the site with questions in mind.
Research
While it may seem obvious, site analysis does not stop at the property lines.
Site analysis should consider the current physical condition of the site and its surroundings, as well as any relevant historical information about what the site looked like previously.
Have there been any significant changes to the physical landscape? The architectural landscape?
What does the site neighbor? How long has the surrounding context been the way it is today? What is the significance of this site to the community it sits within? Generally this information can be acquired via the combination of the following sources:
- Google Street View allows you to select the year in which you’re viewing any given location dating back to 2007. While this is a rather recent record of history, it allows you to witness the changes of a site with some immediacy and in an occupiable way. Google street views as well as aerial photographs can be a great resource for site plans, an underlay or base layer for photoshopped street views, diagrams, and mapping information.
- Tools like CadMapper and CadEarth offer 3D maps to utilize as volumetric references to a site as well as base layers of diagrams.
- Your county or city likely has a website of property records, often including maps that readily provide information on zoning, land ownership, school districts, transportation, utilities, etc.
- Community centers, neighborhood associations, local historical societies and local newspapers are all resources for accessing archives or documented histories of a site and its greater context.

What to Take with You
A camera, notebook, writing utensil, and tape measurer are the basic tools one will need, all of which can at this point be accessed with a smartphone. The following applications are free and easy to use documentation tools that can all be accessed with your single device:
- Video and Photos -- 2D and 360 degree
- Note-taking App like Evernote or Google Keep
- 3D scanning with Display.Land or Matterport scan
- Drones for overhead video, photographic, and volumetric capture
Once you Arrive at the Site
First impressions: take notice of any and all initial responses to the site — sensory data collection, points of entry. Ask questions. How did you arrive at the site? Is it accessible? Is there parking? Nearby traffic or transit? Does that traffic carry sound?
Take note of existing spatial relationships: How do people move about the space? Where do people gravitate naturally? Is there a relationship between this movement and sunlight or shade? Take any necessary measurements, if not already provided via a site plan.
Visual documentation: photographs, sketches, video — it’s good practice to have photos of the site itself as well as looking out from the site. These images can be used for annotations or for context in later perspectives and renderings.

Analysis
Once you have visited the site and collected your information, you will begin the process of examining your findings. This will mostly consist of sitting with the information you’ve gathered, putting your findings alongside one another, and exploring their relationships. The analysis stage can be visual, and for some is the iterative stage of site analysis diagramming. Consider the goals of your project and the impacts of the site’s characteristics — what have you learned, and how will it guide you moving forward?
Synthesis
The synthesis of your collected information and conclusions drawn throughout the stages of site analysis will inform each project with context at every step and scale. While it is important to collect data, data collection is useless unless transcribed into relevant and digestible content. Through the process of analysis you will find that certain site conditions will have greater influence over design parameters and decision making. Combining your research, observations, and any newfound limitations, you will be ready to apply your findings and begin the schematic design and programming phase.
What's included in a site analysis?
Site analysis should include the climatic, geographical, historical, social, legal, and infrastructural context of a given site.
Presentation of site analysis should include visual representation of the site in the form of annotated photographs, initial sketches of the site, site mapping and site analysis diagrams.
Site analysis diagrams are the tools that begin to illustrate the origins of the design process, what is possible, and what are the conditions that influence decision making.
Who's involved in site analysis?
One’s approach to site analysis will vary based on project size, design team size, and a site’s relative proximity, but the process will always benefit from being collaborative.
As site analysis spans a wide range of data types beyond the scope of design, it is common for the more technical research to be outsourced.
Most projects require consulting with land surveying services and engineers, both geotechnical and civil, who can provide answers to questions surrounding topography, soils, hydrology, utilities, zoning and land uses.
A successful site analysis should also include consideration and input from the community members in which the project is based and thus impacting the most.
Where does site analysis fit in the project delivery process?
The findings gathered throughout site analysis ground an architectural project in reality — its pre-existing context — therefore site analysis is a logical and approachable entrypoint for delivering a project proposal.
With this in mind, creating a visual language for your site analysis diagrams that is consistent with your design delivery proposal is an opportunity to create a visual throughline in your presentation.
Your site analysis will then become the backdrop to the remainder of your design proposal. Depending on your delivery method, some site analyses will take the shape of an informational packet that a client can take with them or receive ahead of time.
Examples of Site Analysis

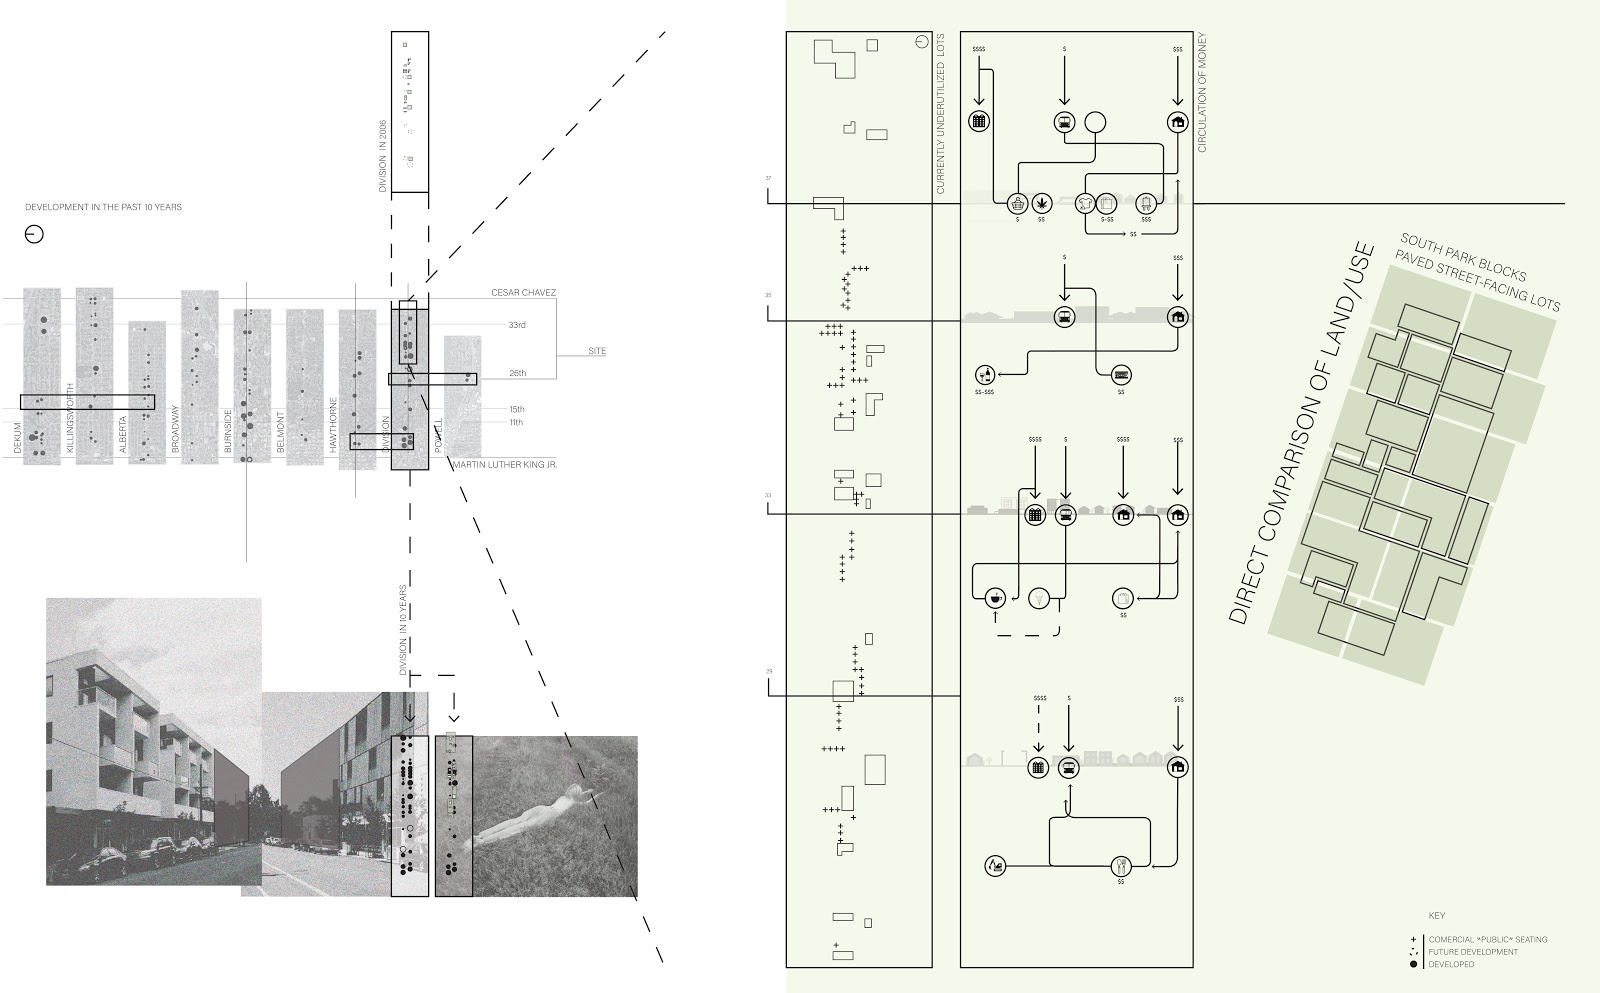
Producing a site analysis diagram is essentially mapping information. There are many different methods of producing site analysis diagrams. Diagrams can be narrative, subjective, or objective.
They may be used to build a story or present the findings of your information at face value. Each method will reveal the relationships of your findings in different ways — do your best to utilize a method of diagramming that best reveals the characteristics of your site and guides you into your design process.
It is likely that site analysis will continue throughout the design process as new questions arise. The process of translating your data collection into visual information reveals patterns that could not have been understood otherwise.
Starting with your base site drawing or image and superimposing your data collection on top of the same base layer, you can begin to take note of how various characteristics of the site interact or influence each other, revealing how relationships are formed between different qualities.
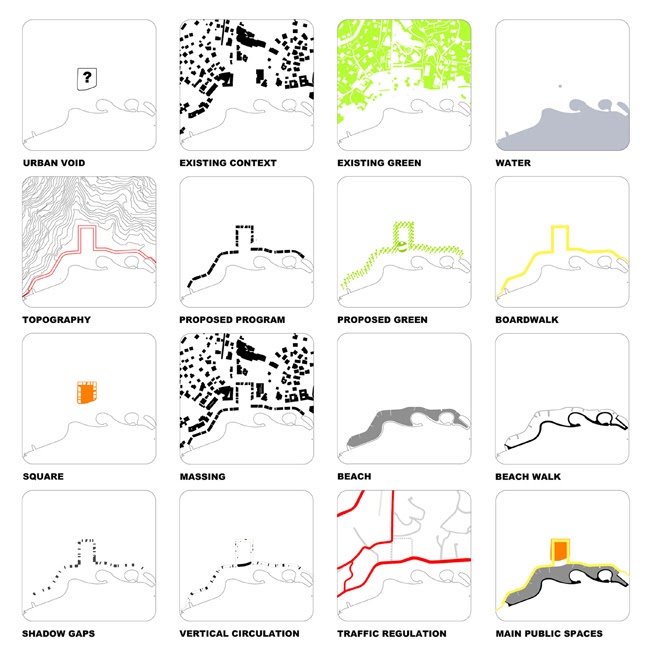
Superimposing or extruding multiple data sets over your base site drawing is just one way of diagramming that may emphasize that the characteristics of the site do not exist in a bubble, but all play into one another.
That being said, consider which drawing type will best present the data you want to show — an extruded axon may look beautiful, but might not be the best way to show how street lighting impacts your site.

As with any map, the decisions made in terms of what information is included and excluded gives importance to information.
You can create visual hierarchies to further distinguish which details of your site analysis findings hold significance moving forward in the design process.
This can be done through line weight or repetition of information.
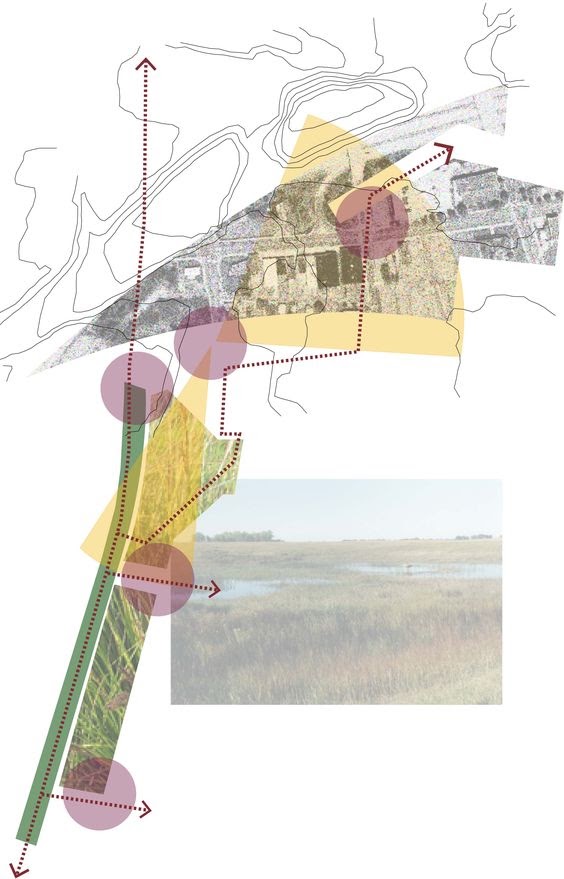
There is no format for producing a site analysis diagram — you will find that historically different methods of producing site analysis diagrams have been used to serve the interests of various influential voices or motives of a given project. Some site analysis diagrams are more schematic, potentially for the purpose of simplifying information, although this can be reductive; others take on a more experiential or representational style, which can be effective in reaching a more spatially or visually oriented viewer.
Conclusion
As an architectural designer, you have the ability to use all aspects of a project to further articulate the concepts of the eventual architecture you’re aiming to produce. In preparation for beginning the design phase of a project, it is crucial to familiarize and understand the context in which you’re designing to the best of your abilities. In observing the material conditions and history of a site, sitting with these characteristics and their implications, you can begin to ground an architectural project in reality.
The questions that are answered through the process of site analysis will lead you into the programming/schematic design phase, inform the decisions made throughout the remainder of the design process, and, if done successfully, should reflect the needs of the community the project sits within. You may very well find that the site assigned is not well suited for the project at hand. There is no better indication for the success of an architectural project than its ability to meet the needs of those who utilize and are most impacted by it.
Interested in optimizing more of your firm's performance? Get started with Monograph today.
Additional Resources
https://www.next.cc/journey/tools/site-analysis
https://www.qpractice.com/programming-site-analysis/
https://wingtra.com/drone-mapping-applications/surveying-gis/
https://www.youtube.com/watch?v=p4eZedz18zw